Chapter 6: Visualizing Results – Charts for Resource Usage, Buffers and Workers
This chapter will introduce you to user interface objects in Plant Simulation. After completing this chapter, you will be able to:
- Visualize resource statistics and buffer occupancy
- Visualize worker statistics
Charts
Plant Simulation provides different chart objects to visualize and analyze simulation results. Charts are updated during runtime. Therefore, if you view a chart during the simulation run, you will be able to see how the recorded values change over the course of the simulation.
Chart ![]() shows the statistics of data sets that were recorded during a simulation run. It collects the data either from a table file or directly from other objects defined in the input channels. There are three statistics types that can be displayed by the chart: Resource Statistics, Energy Statistics, and Occupancy.
shows the statistics of data sets that were recorded during a simulation run. It collects the data either from a table file or directly from other objects defined in the input channels. There are three statistics types that can be displayed by the chart: Resource Statistics, Energy Statistics, and Occupancy.
The Chart object is also equipped with a Statistics Wizard, with which you can specify the classes of objects that you want to show their statistics values. Alternatively, if you drag & drop a material flow object onto the Chart, it will be stored in the input channel and used to record the statistics values.
WorkerChart ![]() shows utilization statistics of all workers located in a WorkerPool.
shows utilization statistics of all workers located in a WorkerPool.
WorkerSankeyDiagramm ![]() visualizes the frequency of the paths taken by Worker that moves freely within the area. The flow of the WorkerSankeyDiagram is shown only in 3D.
visualizes the frequency of the paths taken by Worker that moves freely within the area. The flow of the WorkerSankeyDiagram is shown only in 3D.
Exercise: Resource utilization & buffer occupancy
In this exercise, we will visualize the resource utilization of all processing stations in our facility. We will also visualize the occupancy of the buffer between the Bending and LaserCutting station in the manufacturing area as well as the occupancy of the inbound buffer in the assembly area. Similar to previous exercises, it is highly recommended that you only make changes in the frames in the folder FacilityArea in the Class Library
Step-by-Step:
- Open the Manufacturing frame under the folder FacilityArea in the Class Library. Navigate to the User Interface tab in the Toolbox. Insert a Chart object from the Toolbox into the frame and rename it to “ResourceChart”.
- Drag & drop a processing station, e.g. the Punching1 station onto the ResourceChart. A dialog window will appear where you can select the statistics type for configuring the chart. Select Resource Statistics from the dropdown menu and click OK.
- Right-click on the ResourceChart and select Show from the context menu. You should see the station in the x-axis. Drag & drop all other processing stations onto the ResourceChart to add them to the chart.
- Insert another Chart object from the Toolbox into the frame and rename it to “BufferChart”.
- Drag & drop the Buffer1 onto the BufferChart. Select Occupancy from the dropdown menu in the Statistics Type dialog window and click OK. The icon of the BufferChart will automatically change.
- Repeat the same steps to create a ResourceChart and a BufferChart for the Assembly frame in the folder FacilityArea.
- Open the Plant frame and run the simulation. Decrease the speed and double-click either on the Manufacturing frame or the Assembly frame in the Plant frame to open. Right-click on the Chart objects and select Show. See how the statistics values change during the simulation. Compare the BufferChart of the Manufacturing frame with the BufferChart of the Assembly frame.
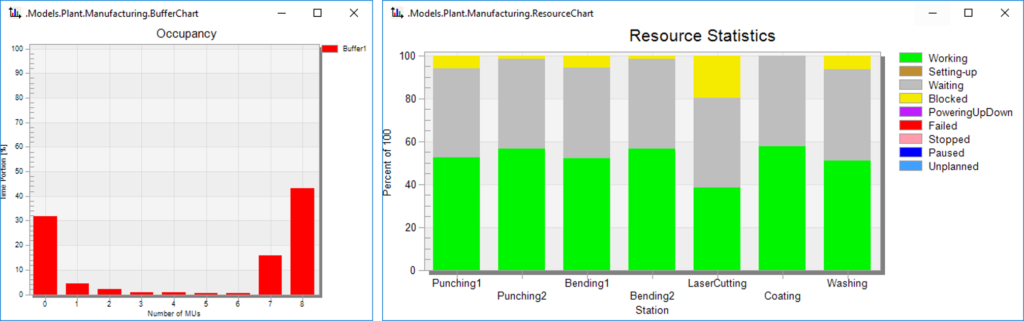
Figure 35: Buffer occupancy chart (left) and resource statistics chart (right)
Exercise: Worker statistics
In this exercise, we will visualize the worker statistics in the assembly area of our production facility. Similar to previous exercises, it is highly recommended that you only make changes in the frames in the folder FacilityArea in the Class Library.
Step-by-Step:
- If the WorkerChart object is not present, click on the icon Manage Class Library from the Home ribbon tab. Navigate to the Libraries tab and check the box Worker Chart under the Tools Click OK.
- Navigate to the Tools tab in the Toolbox. Now you will see the WorkerChart object here.
- Open the Assembly frame under the folder FacilityArea in your Class Library. Navigate to the Tools tab in the Toolbox. Insert the WorkerChart from the Toolbox into the frame.
- Drag & drop the WorkerPool onto the WorkerChart in the frame. A dialog window will appear. Select “Group Workers by Individuals” to show each individual Worker in the statistics and “Occupancy with respect to Working time”. Click on Apply & OK.
- Open the Plant frame and run the simulation. Double-click on the Assembly frame in the Plant frame to open it. Right-click on the WorkerChart and select View Chart.
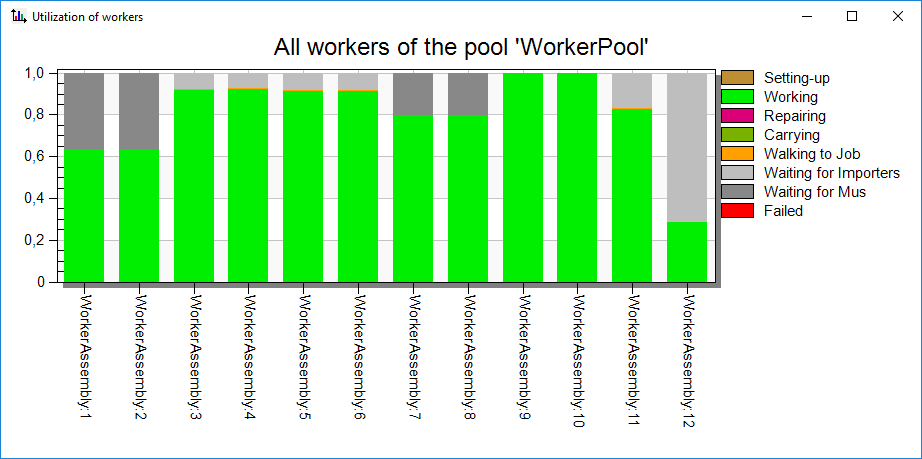
Figure 36: Visualization of worker utilization
Download:
The final state of the simulation model up to this exercise can be downloaded here Tutorial_Model_08. Your simulation model should look similar to the figure below.
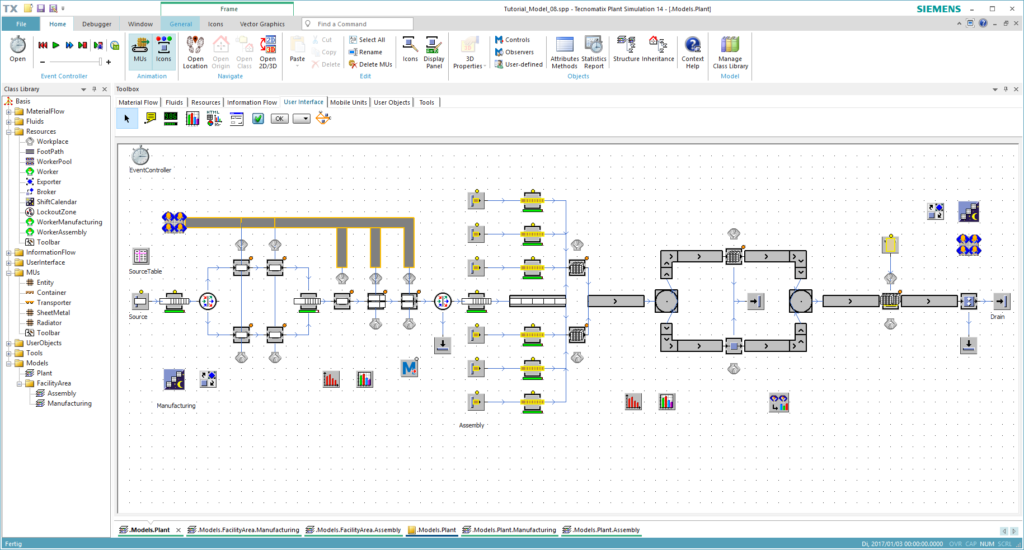
Figure 37: Final model of this chapter